The NetVane guide
Everything you need to install NetVane, run your first scan, and act on what it finds — practical, step-by-step, and accurate to how the app actually works.
Installation
NetVane is Windows-only and fully self-contained — no admin rights, no Python, no .NET, no drivers. It ships two ways:
- Installer —
NetVane-Setup-1.3.1.exe(recommended). A per-user install (no admin, no UAC) that adds shortcuts and removes any older version. - Portable —
NetVane-Portable-1.3.1.exe. One self-contained file you run from anywhere, nothing to install.
With the installer, your data (settings and the SQLite netvane.db) lives in %LocalAppData%\NetVane; the portable build keeps it in a NetVane-Data folder beside the exe, so the whole thing moves with the file. Full requirements are on the Specs page.
Windows (prebuilt binary)
- 1Download the installer or portable exe from the download page — a direct download, no account needed.
- 2Run the installer, or double-click the portable file.
- 3NetVane starts a local server at
127.0.0.1:8787and opens the dashboard in a chromeless app window (Brave or Chrome if present, otherwise a browser tab).
Run from source (advanced)
NetVane targets Windows (it uses a few Windows-native APIs); macOS and Linux aren't supported yet.
- 1Install Python 3.10+ (3.12 recommended) and clone the repo.
- 2Install dependencies:
pip install -r requirements.txt - 3Start it:
Then openpython run.pyhttp://127.0.0.1:8787.
Your first scan
With NetVane running, a scan is a few clicks — discovery is read-only, and the follow-up validation is non-destructive.
- 1Open
http://127.0.0.1:8787if it isn't already open. - 2Confirm or enter your network range. NetVane suggests your local subnet (e.g.
192.168.1.0/24); adjust it to any range you're authorized to scan. - 3Pick a scan profile — Standard is the everyday default. See Choosing a scan profile.
- 4Press Scan (or tap s).
- 5Watch devices stream in live as they're discovered.
The dashboard, view by view
NetVane has four views — Overview, Network, Security, and Activity, in rail order. Switch between them from the navigation rail down the left edge, the command palette (Ctrl+K), or number keys 1–4 (matching that order). The rail also holds Settings at its foot; the slim top bar carries the primary Scan menu and a ⋯ overflow menu with everything else — the security report, CSV export, Update intelligence (refreshes the CVE and device-fingerprint databases), Help & shortcuts, About, and more.
Network — your devices, with three lenses you switch between:
- Map — a live topology map showing how everything hangs off your gateway. Click a node to open a device. A scan can't see inside a switch, so devices sit under the gateway until you set a device's "Connected via" to place it under its switch or AP and draw the real hierarchy.
- List — the full inventory as a sortable table. Click an IP or MAC to copy it, use structured search to filter, and click a row for detail, exposures, and history.
- Presence — who's on your network right now, grouped so you can see at a glance what's here, what just arrived, and what's gone quiet.
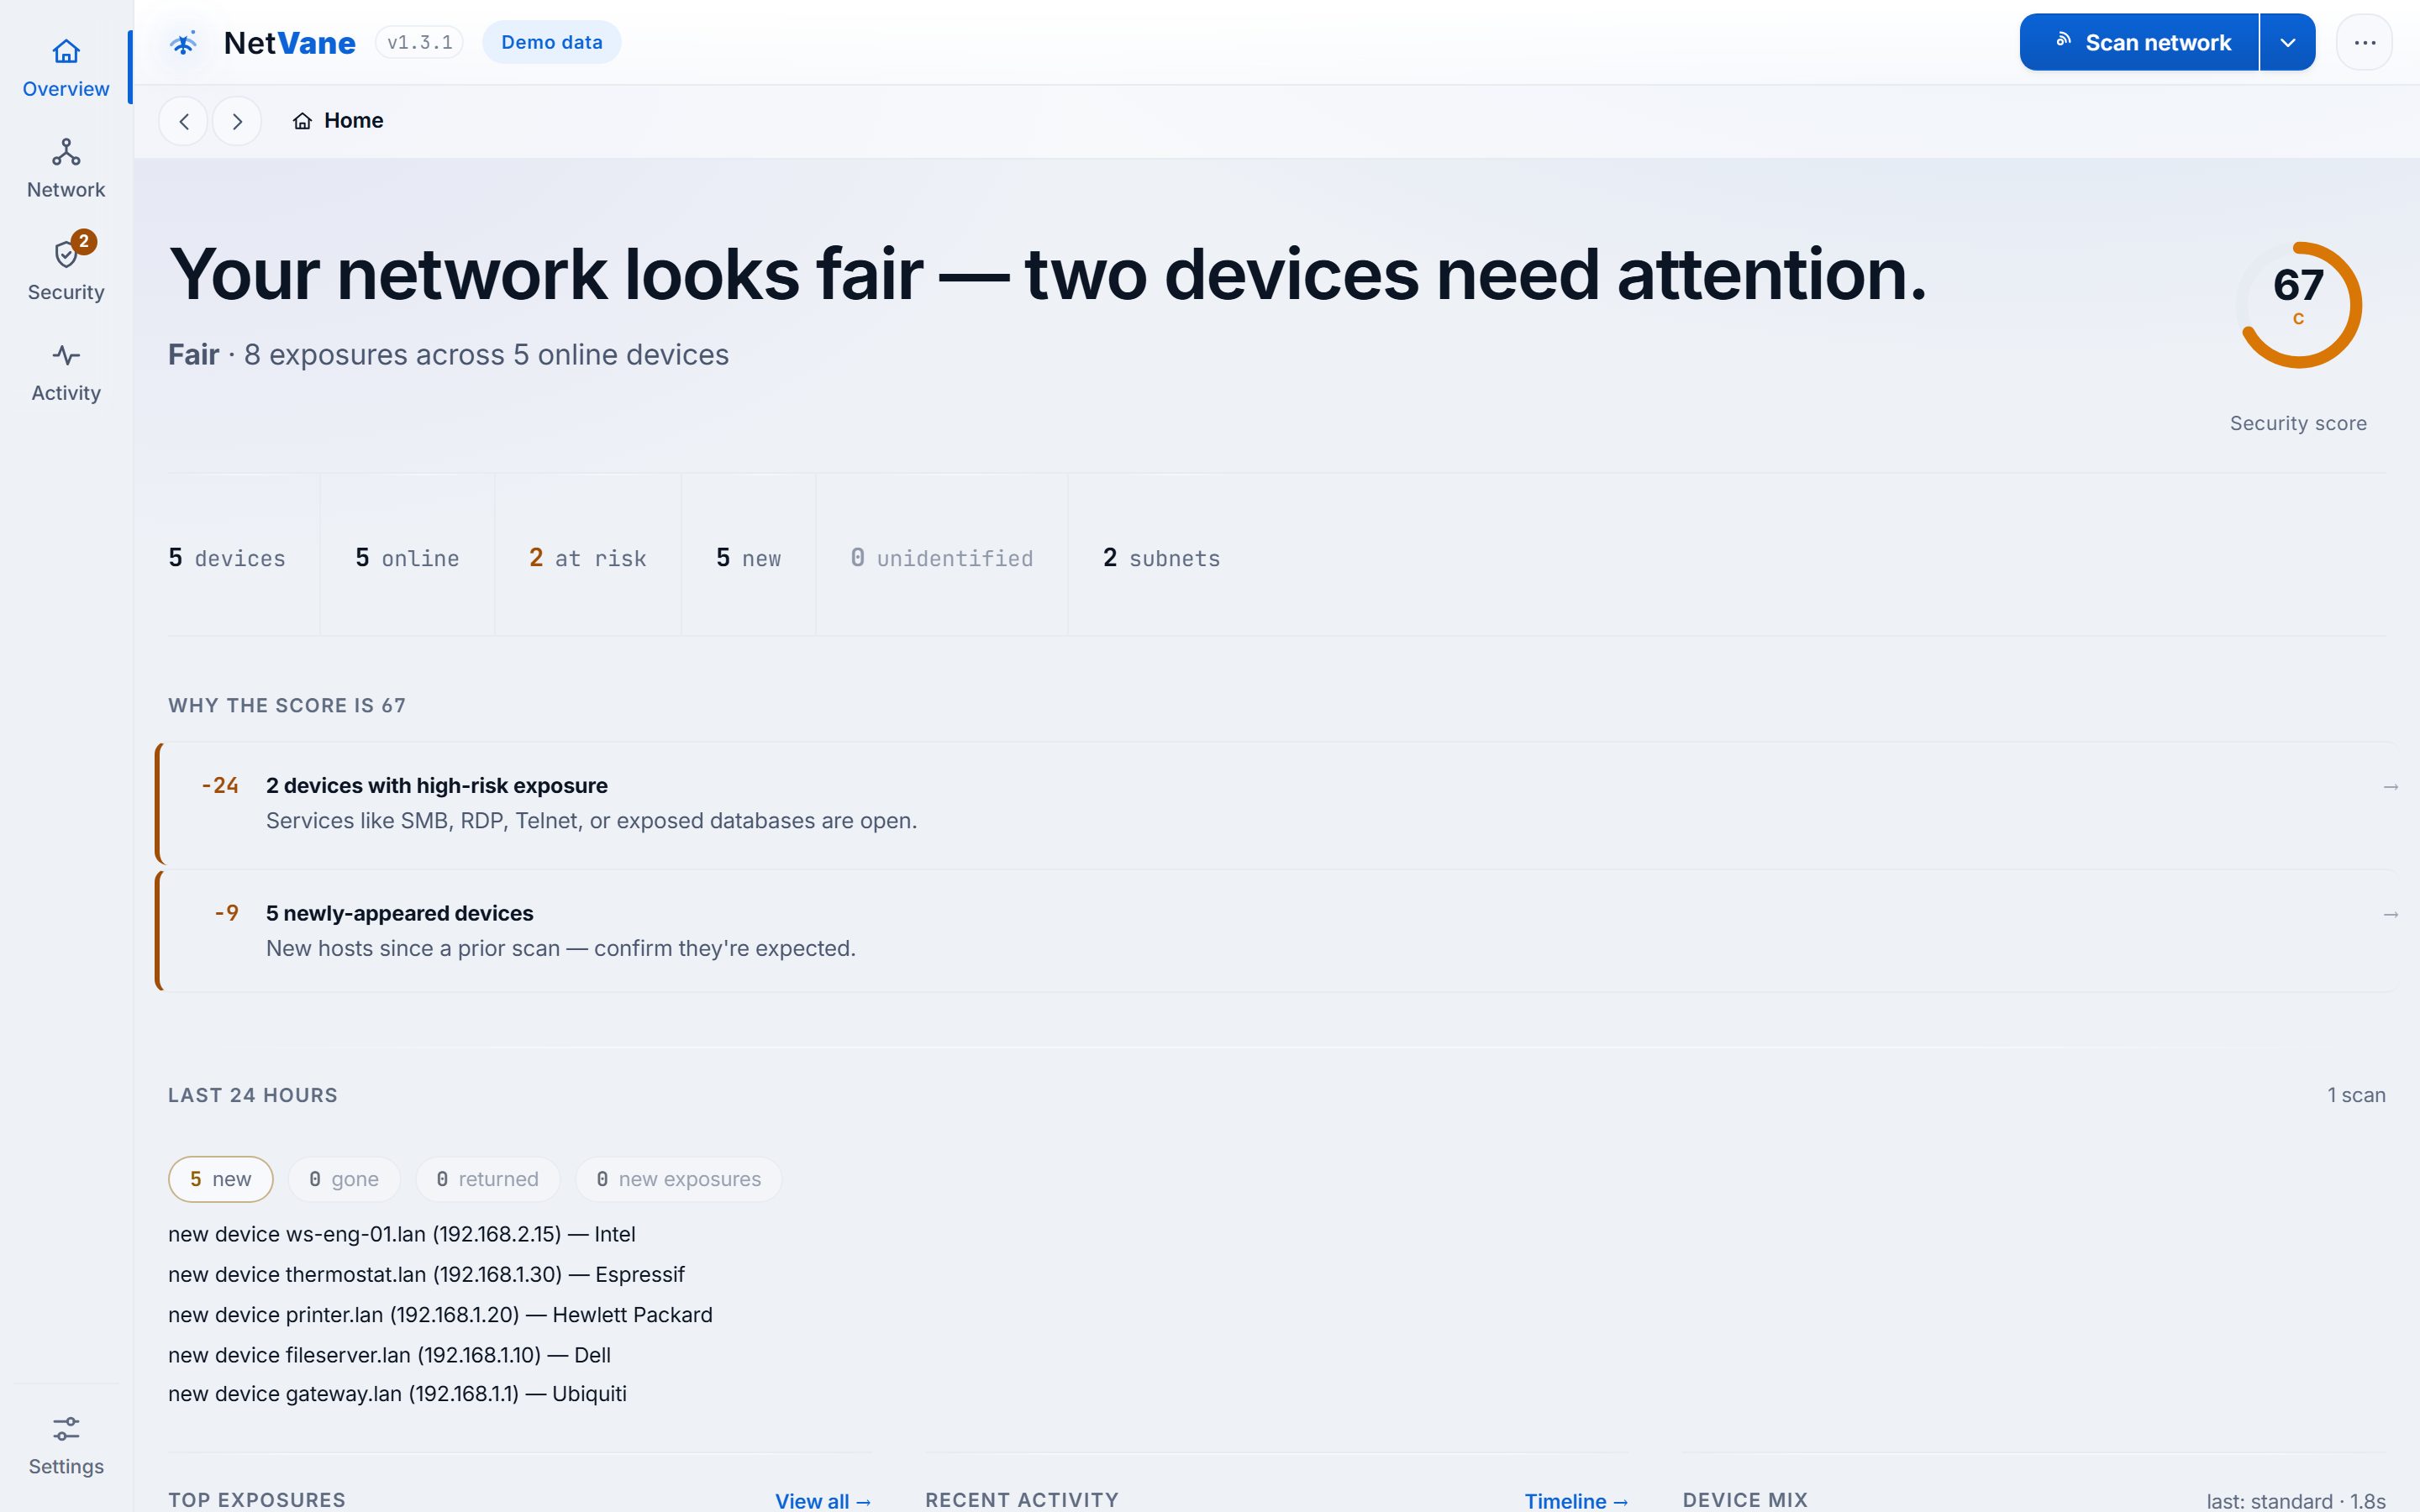
Overview — the at-a-glance dashboard: security score and grade, device counts, and headline changes since your last scan. Click any figure to drop into the matching devices.
Security — reachable notable services grouped by device, each with why-it-matters, risk, and how-to-fix (see Fixing an exposure) — plus a set of insight cards that read what NetVane already gathered, all local: "Is your smart home contained?" (whether your cameras/speakers/plugs share a network with your computers, with a guest-network fix), Router & gateway health (DNS trust, gateway identity, risky remote-admin, firmware currency in one verdict), DNS speed (benchmark your resolvers against reputable public ones), and Network behavior watch — device behavior analytics that learns your network's normal and flags meaningful drift (a sudden sustained upload spike, a new internet port-forward, or a stable smart-home device that suddenly opens a port). These never change your score and there's nothing to turn on.
Activity — with two sections: Timeline, the change history (ports opened or closed, service / OS / hostname changes, and devices that arrived, returned, or went missing) — readable either as the raw event feed or as a Diary, grouped by day with a plain-language narration for each day; and Scans & trends, your scan history — review past runs, see the score charted over time, and compare any two scans.
Choosing a scan profile
In the app this control is labelled Scan depth — the profiles below are its options.
Five profiles — Discovery, Quick, Standard, Thorough, and Aggressive — trade thoroughness for speed by varying how many ports they check and how much detail they gather; none of them attack, exploit, or change anything. Start with Standard for everyday runs; reach for Thorough or Aggressive to deeply audit a single device you own. The Specs page has the full per-profile breakdown.
Reading your security score
NetVane scores your network 0–100 with a letter grade (A–F). It's not a black box — each factor shows the exact points it costs you. Points are deducted for:
- High-risk exposures — reachable notable services (see Fixing an exposure).
- Unidentified devices — hardware NetVane couldn't confidently classify.
- Unexpected new devices — things that appeared and you haven't acknowledged.
The score is charted over time under Activity → Scans & trends, and NetVane alerts you when it drops. To raise it, work down the three lists above.
Fixing an exposure
NetVane flags reachable “notable” services — cleartext protocols, file shares, remote desktop, databases, admin panels, and more (the full list is on the Specs page). Each comes with everything you need to close it.
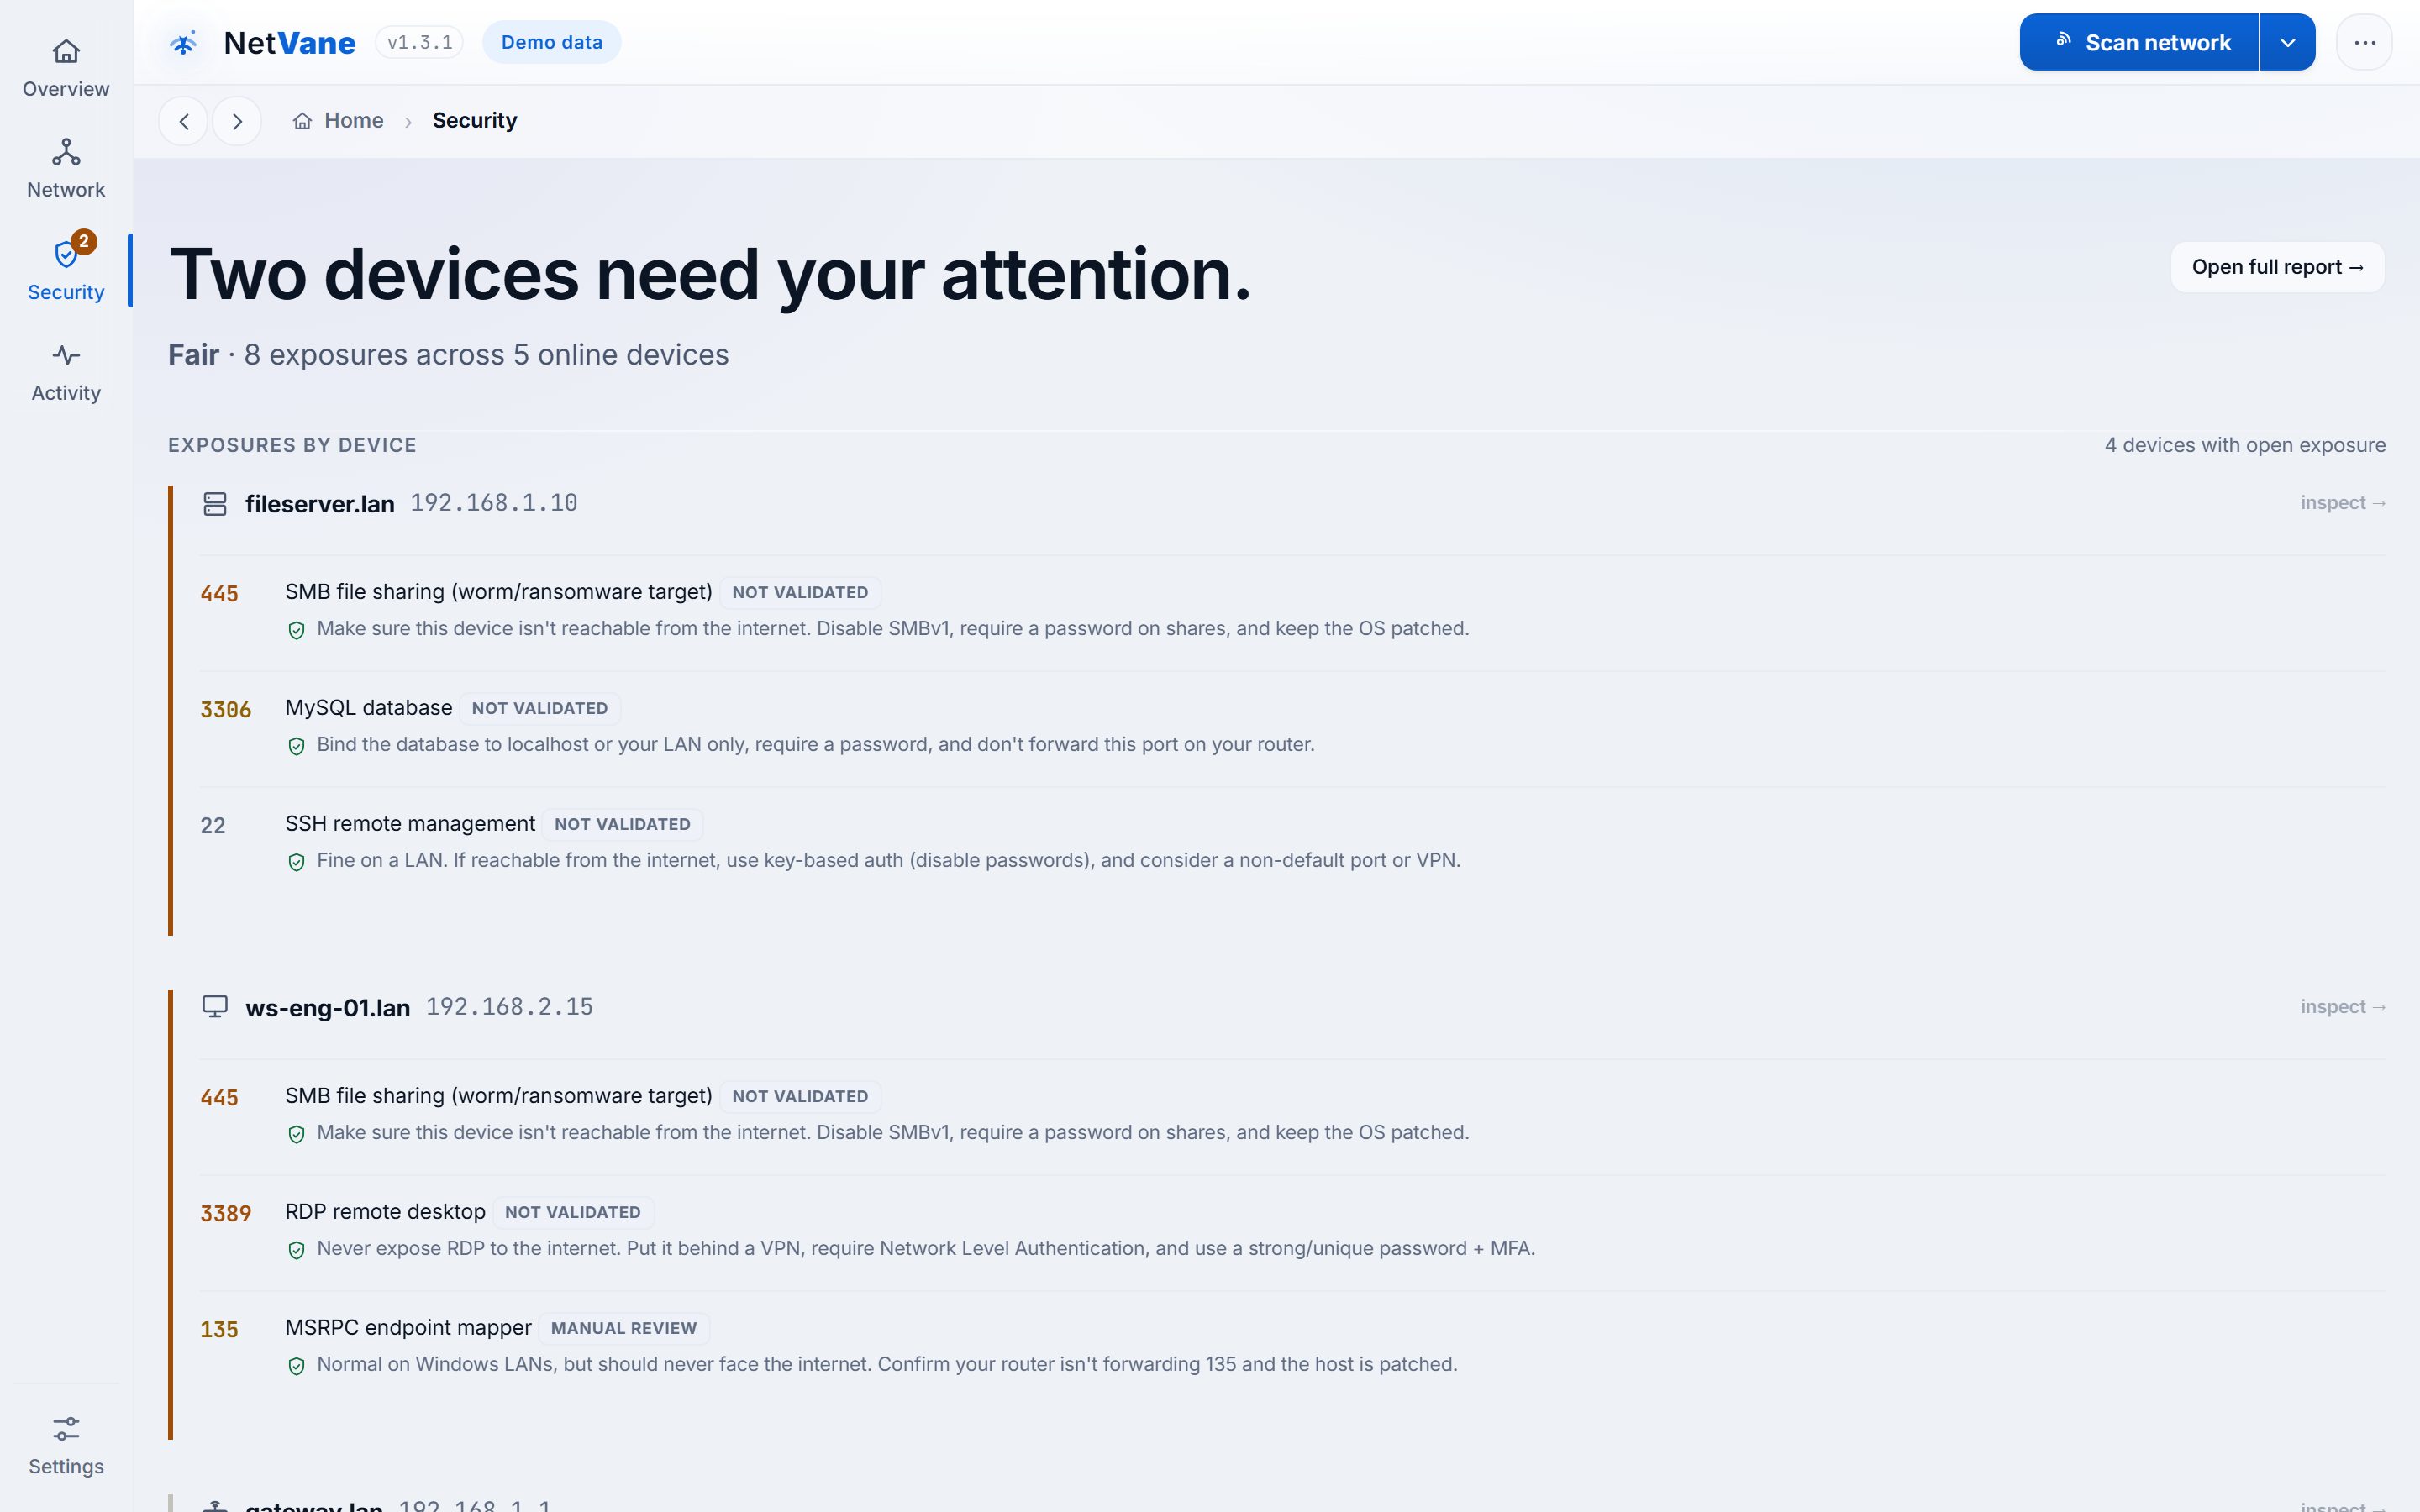
- 1On the Security view (or a device's detail), click an exposure to open its Fix panel.
- 2Read it: why it matters, the risk of ignoring it, and the step-by-step fix (you can copy the steps).
- 3Click through to open the device's own admin page.
- 4Make the change there — disable the service, close the port, set a password, whatever the steps call for.
- 5Back in NetVane, click Verify to re-scan just that host and confirm the exposure is resolved or still open — a real closed-loop check.
Identifying & naming devices
NetVane infers each device's type (router, camera, phone, workstation, printer, IoT, and so on) from its open ports, vendor (a bundled offline OUI/MAC registry), hostname, and OS, and flags the randomized/private MACs common on phones. You can help it along:
- Deep Identify — for a device it can't name, run the opt-in deep Identify to query mDNS and NetBIOS for its name (opt-in because it sends a couple of extra local queries).
- Friendly label — give any device a name (“Living-room TV”) so it's recognisable across scans instead of a bare IP or MAC.
- Acknowledge — mark an expected new device as known to clear its “unexpected new device” score deduction.
Scheduling recurring scans
NetVane can scan on a schedule: turn on the recurring-scan toggle and set an interval in hours (every 12 or 24 hours is common).
Change alerts & webhook
When a scan finds something new — a port opened, a device arrived or departed, your score dropped — NetVane can notify you two ways:
- Desktop notifications — a native notification on the machine running NetVane. Fully local.
- Webhook (optional) — if you configure one, NetVane POSTs change alerts to a URL you provide. This and the support report you can choose to send from Report a problem are the only outbound traffic that carries any data about your network — and each happens only because you asked.
netvane.doorvane.com — an app-update check, and CVE-database, device-fingerprint and network-owner updates — and none sends any data about your network; they only ask whether something newer exists. Everything else lives in the local netvane.db.
Per-device flow analytics — pointing your router at NetVane
On a modern (switched) network, NetVane cannot see where each device sends its data — only your router sees every device's traffic. Many routers can export that visibility as flow records (NetFlow v5/v9, IPFIX, or sFlow) to a collector on your network. Point that export at the PC running NetVane and it learns, per device, which external destinations are normal — then flags a device that suddenly sends real volume somewhere it has never sent data before: the classic signature of a compromised device exfiltrating data. The collector is receive-only, accepts packets only from the router you name, and nothing about your network leaves your machine.
This is opt-in and needs a router that can export flow records. Most ISP-supplied routers cannot — and that's fine: everything else in NetVane, including the network-wide behavior watch and the data-usage chart, works without it.
Step 1 — turn the collector on in NetVane
- Open Settings and find Per-device flow collector. Turn it on.
- Router / exporter IP — enter your router's LAN address (usually your gateway, e.g.
192.168.1.1). NetVane accepts flow packets only from this address. - Collector UDP port — leave the default
2055unless it clashes with something else on this PC. - Save. NetVane is now listening.
New-NetFirewallRule -DisplayName "NetVane flow collector" -Direction Inbound -Protocol UDP -LocalPort 2055 -Action Allow -Profile PrivateStep 2 — point your router's flow export at this PC
Every platform asks for the same three values, whatever it calls them:
- Collector / destination / target host — this PC's LAN IP (shown in NetVane's device list; give this PC a static/reserved IP so it doesn't change).
- Port —
2055(UDP), or whatever you set above. - Version / format — NetFlow v5 or v9, IPFIX, or sFlow v5. NetVane accepts all four.
Where that lives on common platforms — we link each vendor's own guide rather than paraphrasing menus that change between firmware versions:
- UniFi (supported UniFi gateways) — Settings → CyberSecure → Traffic Logging → NetFlow (IPFIX), per Ubiquiti's Traffic Flows and Traffic Logging article — check its requirements section, as some gateways (UDR, Express, UXG-Lite and others) don't support export. Note UniFi exports sampled data, so per-device volumes are estimates.
- pfSense — install the softflowd package (Netgate's guide); on pfSense Plus 24.03+ there is also a built-in exporter (Firewall Packet Flow Data).
- OPNsense — built in: Reporting → NetFlow (OPNsense manual). Add this PC as a destination.
- MikroTik RouterOS — IP → Traffic Flow (MikroTik's Traffic Flow docs): enable it, then add a target with this PC's IP and port.
- OpenWrt — install the softflowd package (package page) and set its host/port options to this PC.
Menu paths above come from each vendor's linked documentation and can shift between firmware versions — when they disagree, trust the vendor's page.
Step 3 — confirm it's flowing
- Generate some traffic (browse, stream a minute of video).
- In Settings, under the collector, click Check reception. It tells you plainly whether records are arriving — and if packets are coming from a different address than the exporter you configured (the most common mistake), it names that address so you can fix one side or the other.
- Once records arrive, a Where your devices connect card appears on the Security screen showing each device's learned destinations.
Exports & the security report
NetVane produces a self-contained, printable HTML security report — save it as a PDF with Print → Save as PDF. It leads with a priority action plan (a ranked, de-duplicated to-do list grouped by fix, showing which devices and ports each item affects), followed by exposures by device, the accepted-risks ledger, your score breakdown, and the full inventory.
Structured search
The device list (Network → List) mixes free text with field terms — combine as many as you like, and all must match:
risk: takes high, medium, info, or any. For example:
- High-risk cameras:
risk:high type:camera - Anything with SMB reachable:
port:445 - Online Windows machines from one vendor:
os:windows status:online vendor:dell
Keyboard shortcuts
NetVane is fully keyboard-driven. Open the command palette with Ctrl+K to search every action, or use these directly:
| Key | Action |
|---|---|
| Ctrl+K | Open the command palette |
| 1–4 | Switch views (Overview, Network, Security, Activity) |
| / | Jump to search |
| s | Start a scan |
| t | Toggle dark / light theme |
| ? | Show keyboard help |
| Esc | Close a panel or dialog |
Running in the background
By default, closing the window quits NetVane. Turn on Settings → Appearance & startup → Run in the background and closing the window instead drops it to the system tray — scheduled scans keep running, and you reopen or quit from the tray menu.
- Tray alerts — a background scan raises a native Windows notification when it finds a new, changed, or missing device.
- Start automatically at login — the companion toggle launches NetVane minimized to the tray at sign-in (per-user, no admin).
Both are off by default. Pair them with recurring scans to turn NetVane into a quiet always-on monitor.
Diagnostics & support
⋯ → Report a problem… opens a shareable, plain-text health report — app version, platform, scan engine, CVE-database status, device count, and the tail of the log — with every device IP and MAC removed. Use Copy report for a support message, or Open logs folder to reveal the log directory (%LOCALAPPDATA%\NetVane\logs). Nothing is ever sent automatically; you decide what to share.
Experimental scanning
These controls live in Settings’ Advanced section, which is hidden until you turn it on: open Settings, switch Advanced mode on, then pick Advanced in the left-hand list. Advanced → Experimental scanning (off by default) enables two features still being validated on real-world networks:
- Two-phase deep scan — with the nmap engine, NetVane first finds which hosts are alive, then runs the heavy scan only against those, wasting no time on dead addresses across a large subnet.
- Multi-network auto-detect — on a fresh setup, NetVane detects every local network your machine is on (up to five) and targets them all, covering a multi-subnet home with no manual config.
Your normal scan behaviour is unchanged until you turn it on. If your network blocks ping, NetVane automatically falls back to the single-pass path.
The two scan engines
The built-in engine is the default — fast and reliable everywhere; nmap is an opt-in “Deep scan.”
- Built-in (default) — pure Python, nothing to install. TCP-connect port scanning, ARP-table MAC → vendor, reverse-DNS names, service banners, and latency. No raw packets, no admin, no Npcap — it discovers the whole LAN in seconds.
- Deep scan (nmap) — opt-in. Adds OS fingerprinting and richer version detection (better CVE matching), but it's slower and needs raw-socket privileges, so on a per-user install it may return a degraded result — which is why it isn't the default.
Set it under Settings → Advanced → Scan engine — turn Advanced mode on in Settings first, or edit the scan_engine key directly: auto/native use the built-in engine, nmap selects the deep scan. A header pill shows which is active.
Troubleshooting
| Symptom | What to do |
|---|---|
| SmartScreen prompt on first run | Check it names GRCSAC — click More info → Run anyway. |
| Port 8787 already in use | Another program (or a second copy of NetVane) is holding it. Close that, then relaunch. |
| Slow first start | A cold start can take 10–40 seconds the first time as the binary unpacks. The browser opens once the server is ready. |
| No devices found | Check the network range matches your subnet and no host firewall is blocking discovery. Try the Discovery profile first. |
| nmap installed but not used | By design — NetVane never switches engines on its own. Turn Advanced mode on in Settings, then set Advanced → Scan engine to nmap explicitly (and ensure nmap is on your PATH). |
| Scans seem slow | Pick a lighter profile — Thorough and Aggressive scan all 65,535 ports. Drop to Standard or Quick. |